48th Australian Adult National Championship
AMF Mt Gravatt, Brisbane - October 3th to October 24th, 2009
2009 Championship Scores
Scores
National
Adult
Masters
Qualifying Scores
Men's Division
Round 1
Round 2
Round 3
Round 4
Round 5
Round 6 Final
Final Positions
Results (Tennis Format)
Women's Division
Round 1
Round 2
Round 3
Round 4
Round 5
Round 6 Final
Final Positions
Results (Tennis Format)
Event Format and Rules
Previous Winners
Photos
Masters Format (Draw)
Walter
Rachuig
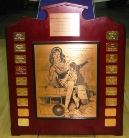
Trophy
Rachuig Teams
Rachuig Rules
Rachuig Scores
Team Photos
Seniors Cup
Qualifying Score
Elimination Qualifying Men
Elimination Qualifying Women
Grand Seniors Tournament
Men's Final
Women's Final
Event Format and Rules
Previous Winners
Winners Photos
National
Seniors
Challenge
Senior Teams
Challenge Rules
Scores
Team Photos
Photos durung challenge -Snaps
Restricted Cup
Qualifying Score
Elimination Qualifying Men
Elimination Qualifying Women
Men's Final
Women's Final
Event Format and Rules
Previous Winners
Winners Photos
National
Restricted
Challenge
Restricted Teams
Challenge Rules
Scores
Team Photos
Photos durung challenge -Snaps
Classic Cup
Qualifying Score
Elimination Qualifying Men
Elimination Qualifying Women
Men's Final
Women's Final
Event Format and Rules
Previous Winners
Winners Photos
Information
Entry Forms
Event Schedule
Information and Details of Nationals
Oil Patterns
Ball Registration Form
Participant Registration Form and Entry Form
Map
Presentation Dinners
State Team Registration Form
Tenpin Bowling Australia Main Web Page
Tenpin Bowling Australia Events Web Page
2009 Adult Nationals Main Web Page
2009 National Restricted Teams Challenge
National Restricted Teams Challenge
Singles
Men's Scores
Women's Scores
Points by Team for Men
Points by Team for Women
Doubles
Men's Scores
Women's Scores
Teams
Men's Scores
Women's Scores
All Events
Men's Scores
Women's Scores
Pointscore
Photos during challenge -Snaps
Team Photos
Event Rules
Women's Singles
2009 National Restricted Challenge - Women's Singles
Pos
Bowler
Zone
Hcp
per Gm
G1
G2
G3
G4
G5
G6
Pinfall
Hcp
Total
Hcp
Scr
Ave
High
Pts
1
HUXLEY Carol
Tasmania
36
178
173
178
239
188
183
1139
216
1355
189.83
239
40
2
GYSS Lilian
South Australia
68
163
129
160
140
164
151
907
408
1315
151.17
164
39
3
VANDENHAM Jenny
Victoria
61
133
163
186
157
127
165
931
366
1297
155.17
186
38
4
THOMPSON Yvette
Northern Territory
42
185
181
152
182
176
165
1041
252
1293
173.50
185
37
5=
MORGAN Tania
Queensland
38
169
179
176
146
171
193
1034
228
1262
172.33
193
36
5=
TOWNSEND Julie
New South Wales
42
169
153
146
188
149
205
1010
252
1262
168.33
205
36
7
MARRIOTT Janet
Northern Territory
69
132
146
126
121
169
146
840
414
1254
140.00
169
34
8
SMITH Lorraine
Northern Territory
47
147
197
171
132
164
155
966
282
1248
161.00
197
33
9
SLOAN Kellee
Queensland Inv
45
156
181
159
159
173
140
968
270
1238
161.33
181
32
10
EADES Alice
South Australia
51
97
170
157
146
182
179
931
306
1237
155.17
182
31
11=
RENFREY Coral
Western Australia
37
176
166
162
172
173
163
1012
222
1234
168.67
176
30
11=
DAY-JOHNSTON Sam
Northern Territory
41
163
159
211
149
136
170
988
246
1234
164.67
211
30
13
COWLAND Cheryl
New South Wales
44
137
163
173
155
168
169
965
264
1229
160.83
173
28
14
LOECHEL Karen
South Australia
38
134
216
162
130
184
165
991
228
1219
165.17
216
27
15
DENNIS Cheryl
ACT
52
159
118
164
149
169
144
903
312
1215
150.50
169
26
16
HAWORTH Coral
Queensland Inv
37
158
168
152
165
182
162
987
222
1209
164.50
182
25
17
SEET Pearl
Western Australia
37
183
188
148
179
128
160
986
222
1208
164.33
188
24
18
DAVIS Jeanette
Queensland
39
158
176
172
198
142
126
972
234
1206
162.00
198
23
19
BODNICK Karla
South Australia
68
127
115
124
143
135
152
796
408
1204
132.67
152
22
20=
FORD Kirsten
Victoria
34
180
168
174
142
156
178
998
204
1202
166.33
180
21
20=
GALLO Carla
New South Wales
66
146
148
148
119
140
105
806
396
1202
134.33
148
21
22
ALTRIA Kelly
ACT
28
176
198
133
166
182
175
1030
168
1198
171.67
198
19
23
HAWKES Lyn
Tasmania
42
211
154
167
165
131
116
944
252
1196
157.33
211
18
24
JONES Sue
New South Wales
43
151
156
177
135
170
134
923
258
1181
153.83
177
17
25
SHIH Fely
Western Australia
37
122
179
152
171
152
170
946
222
1168
157.67
179
16
26
WITNEY Catherine
ACT
35
156
180
170
144
150
157
957
210
1167
159.50
180
15
27
THOMPSON Marilyn
Queensland Inv
59
155
110
136
128
145
135
809
354
1163
134.83
155
14
28
KONG Mary
Western Australia
61
172
134
118
117
110
145
796
366
1162
132.67
172
13
29
HANCL Sue
Tasmania
39
118
144
145
179
173
168
927
234
1161
154.50
179
12
30
MORGAN Bronwyn
Queensland
37
158
148
170
145
132
170
923
222
1145
153.83
170
11
31
WADDELL Kylie
Queensland
32
148
160
157
136
149
191
941
192
1133
156.83
191
10
32
CADE Sue
Victoria
41
147
158
158
156
137
130
886
246
1132
147.67
158
9
33
DANIELS Debra
Queensland Inv
77
93
91
115
130
116
124
669
462
1131
111.50
130
8
34
WALKER Rebecca
Tasmania
35
154
154
154
132
131
190
915
210
1125
152.50
190
7
35
BILLINGHAM Sandy
ACT
29
154
173
136
128
133
171
895
174
1069
149.17
173
6
36
TAAFE Kirsten
Victoria
52
134
131
109
141
96
139
750
312
1062
125.00
141
5